TachyTrack
Category
UI/UX Design
Mentor
Tamar Segura
Year
2024
An app designed for people who suffer from POTS, with the goal to return
the patients' quality of life to the most optimal state as quickly as possible
by tracking their symptoms and allowing them to adjust their lifestyle.

Brief
The project focused on exploring new digital solutions within the world of healthcare and pharmaceuticals. The goal was to identify a real medical need and design a user-centered product that could improve patients’ daily lives. I chose to focus on people living with POTS and designed an app to support the ongoing management of the condition.
What Is POTS?
POTS, or Postural Orthostatic Tachycardia Syndrome, is a condition that causes a significant increase in heart rate when a person stands or sits up. Common symptoms include dizziness, fainting, fatigue, and brain fog, making everyday activities difficult and unpredictable.

The Challenge
POTS is still unfamiliar to many healthcare professionals, often leading to delayed diagnosis and limited treatment options. Even after diagnosis, patients are frequently left to manage the condition through trial and error, adjusting medication, diet, and daily habits without clear guidance. Since symptoms and triggers vary widely, finding an effective routine can be a long and frustrating process.
92%
of those diagnosed are women
18–49
the age range for 81% of diagnoses

Who This Is For
Diagnosed
Diagnosed patients looking to improve their day-to-day quality of life by understanding and managing their symptoms
Undiagnosed
Undiagnosed patients who suspect they have POTS and need to collect consistent data to support a diagnosis
Persona
Isabelle, 27
Recently diagnosed with POTS
Her physician isn’t educated on POTS, and she often knows more about the condition than the doctors treating her
Gets most of her information and support from online communities, not clinical guidance
Actively looking for ways to manage and improve her symptoms day to day
Understanding the Pattern
Triggers
Changing positions
Prolonged standing
Dehydration
Heat
Hormonal changes and menstruation
Sugar/carbs/alcohol
Heavy meals
Raising hands
Stress and strong emotions
Symptoms
Lightheadedness
Fainting
Brain fog
Tachycardia
Palpitations
Nausea
Shortness of breath
Blurred vision
Weakness
Fatigue
Headaches
Relievers
Rest
Slow transitions between positions
Cool environments
Increased sodium intake
Increased water intake
Competitive Analysis
Built into the phone
Clean, uncluttered UI
Home screen data summary
Heart rate every 5 min
No real-time alerts
Not built for POTS
A home-screen summary for quick scanning, a clean readable UI, and logging of factors like sodium, water, medication, cycle.
Built for POTS
Continuous heart rate
Graphs by time range
Notes per episode
Doctor-ready records
Complex, confusing graphs
Minimal symptom tracking
Episodes listed only
Graphs by day, week and month, written notes on each episode, and an archive of high-heart-rate episodes.
Extensive data and detail
Notes double as a journal
Dated, cluttered UI
Overloaded graphs
Overwhelming detail
Not built for POTS
Notes attached to logged episodes and days, giving context beyond the raw numbers.
Opportunities
01
How might we help patients spot their personal triggers faster, without manually logging everything themselves?
02
How might we surface abnormal changes in real time, before they turn into fainting or a fall?
03
How might we give patients data they can actually bring to a doctor who may not understand POTS?

01
Last abnormal measure
The full picture of the last episode, captured without having to log everything yourself.
02
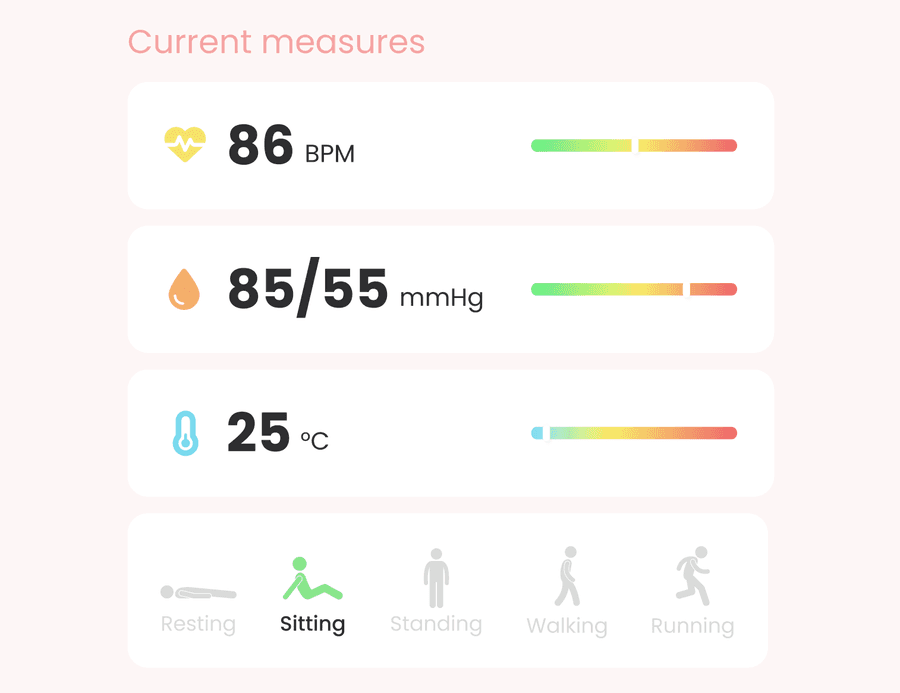
Current measures
Heart rate, blood pressure and temperature in real time, with the current position.

03
Abnormal measure
Every event can be reviewed, edited and exported as a record for the doctor.
Design evolution
Wireframe
Sketch
Final design
The Solution
The app supports this trial-and-error process by syncing with a smart bracelet that tracks heart rate, blood pressure, movement, and temperature in real time. It alerts users to unusual changes and connects symptom patterns with factors such as hydration, sodium intake, medication, activity, and the menstrual cycle. By bringing this information together, the app helps users identify personal triggers, understand what improves or worsens their symptoms, and make more informed decisions about their daily routine.
Onboarding - first launch and sign-up.
An active user responding to an abnormal-measure alert.